Azure Data bricks

Azure Databricks is a cloud-based distributed platform for data processing built on Apache Spark. Databricks was designed to unify data science, data engineering, and business data analytics on Spark.


Azure Databricks is hosted on the Microsoft Azure cloud platform, and integrated with Azure services such as Azure Active Directory, Azure Storage, Azure Synapse Analytics, and Azure Machine Learning.

The Azure Databricks workspace provides a unified interface and tools for most data tasks, including:

·         Data processing workflows scheduling and management

·         Working in SQL

·         Generating dashboards and visualizations

·         Data ingestion

·         Managing security, governance, and HA/DR

·         Data discovery, annotation, and exploration

·         Compute management

·         Machine learning (ML) modeling and tracking

·         ML model serving

·         Source control with Git

Azure Databricks is optimized for three specific types of data workload and associated user personas:

·         Data Science and Engineering

·         Machine Learning

·         SQL*

In addition to the workspace UI, you can interact with Azure Databricks programmatically with the following tools:

·         REST API

·         CLI

·         Terraform

·          

SQL Warehouses are only available in premium Azure Databricks workspaces.


Apache Spark clusters - Spark is a distributed data processing solution that makes use of clusters to scale processing across multiple compute nodes. Each Spark cluster has a driver node to coordinate processing jobs, and one or more worker nodes on which the processing occurs. 

Databricks File System (DBFS) - While each cluster node has its own local file system (on which operating system and other node-specific files are stored), the nodes in a cluster have access to a shared, distributed file system in which they can access and operate on data files. The Databricks File System (DBFS) enables you to mount cloud storage and use it to work with and persist file-based data.

Notebooks - One of the most common ways for data analysts, data scientists, data engineers, and developers to work with Spark is to write code in notebooks

Hive metastore - Hive is an open source technology used to define a relational abstraction layer of tables over file-based data. The tables can then be queried using SQL syntax. The table definitions and details of the file system locations on which they're based is stored in the metastore for a Spark cluster.

Delta Lake - Delta Lake builds on the relational table schema abstraction over files in the data lake to add support for SQL semantics commonly found in relational database systems. Capabilities provided by Delta Lake include transaction logging, data type constraints, and the ability to incorporate streaming data into a relational table. SQL Warehouses - SQL Warehouses are relational compute resources with endpoints that enable client applications to connect to an Azure Databricks workspace and use SQL to work with data in tables. The results of SQL queries can be used to create data visualizations and dashboards to support business analytics and decision making. SQL Warehouses are only available in premium tier Azure Databricks workspaces.


Read file using spark:

df1 = spark.read.format("csv").option("header", "true").load("dbfs:/FileStore/shared_uploads/user@outlook.com/products_1_.csv")


display(df1)

 save it as table

df1.write.saveAsTable("products")


%sql


 SELECT ProductName, ListPrice

 FROM products

 WHERE Category = 'Touring Bikes';


 Azure Databricks service launches and manages Apache Spark clusters within your Azure subscription. Apache Spark clusters are groups of computers that are treated as a single computer and handle the execution of commands issued from notebooks. 

They consist of a Spark driver and worker nodes. The driver node sends work to the worker nodes and instructs them to pull data from a specified data source.

In Databricks, the notebook interface is typically the driver program. This driver program contains the main loop for the program and creates distributed datasets on the cluster, then applies operations to those datasets. Driver programs access Apache Spark through a SparkSession object regardless of deployment location.

Diagram of an example Apache Spark cluster, consisting of a Driver node and four worker nodes.


Work submitted to the cluster is split into as many independent jobs as needed. Jobs are further subdivided into tasks. The input to a job is partitioned into one or more partitions. These partitions are the unit of work for each slot. In between tasks, partitions may need to be reorganized and shared over the network.

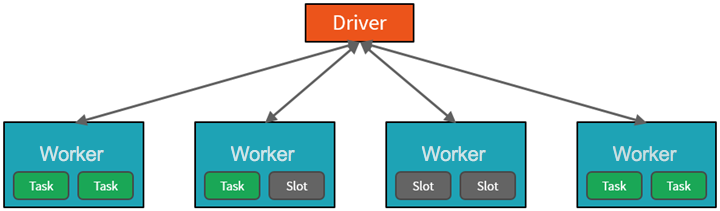
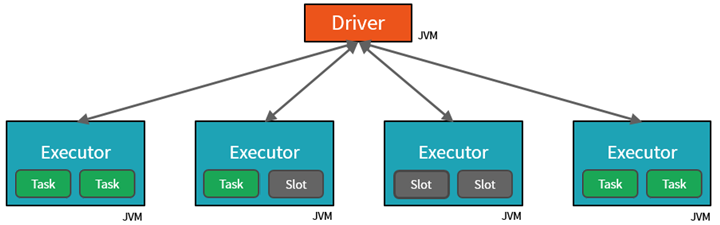
Spark parallelizes jobs at two levels:

  • The first level of parallelization is the executor - a Java virtual machine (JVM) running on a worker node, typically, one instance per node.
  • The second level of parallelization is the slot - the number of which is determined by the number of cores and CPUs of each node.
  • Each executor has multiple slots to which parallelized tasks can be assigned
  • .

Diagram of Spark cluster with tasks.

By splitting the work into tasks, the driver can assign units of work to *slots in the executors on worker nodes for parallel execution. Additionally, the driver determines how to partition the data so that it can be distributed for parallel processing.

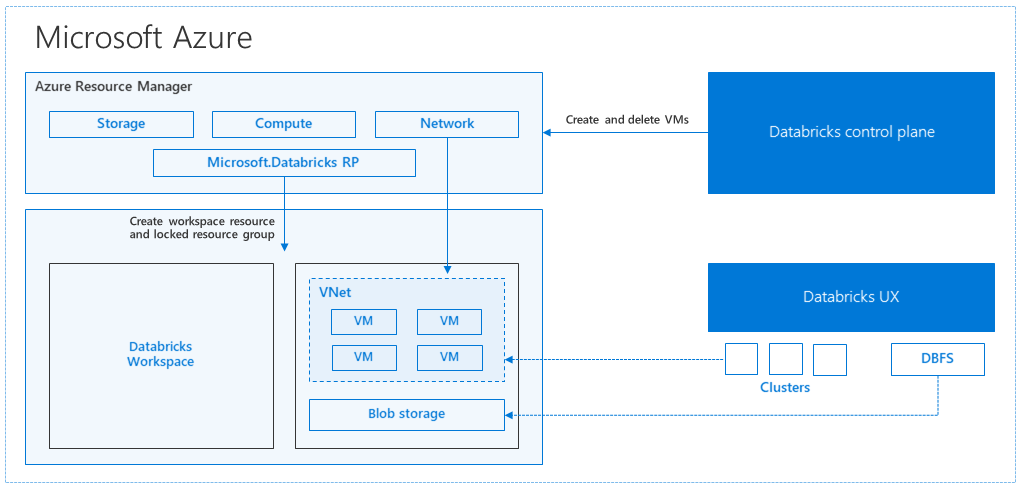
How Azure manages cluster resources

When you create an Azure Databricks workspace, a Databricks appliance is deployed as an Azure resource in your subscription. When you create a cluster in the workspace, you specify the types and sizes of the virtual machines (VMs) to use for both the driver and worker nodes, and some other configuration options, but Azure Databricks manages all other aspects of the cluster.


All metadata for your cluster, such as scheduled jobs, is stored in an Azure Database with geo-replication for fault tolerance.

Internally, Azure Kubernetes Service (AKS) is used to run the Azure Databricks control-plane and data-planes via containers running on the latest generation of Azure hardware (Dv3 VMs), with NvMe SSDs capable of blazing 100us latency on high-performance Azure virtual machines with accelerated networking.

 After the services within your managed resource group are ready, you can manage the Databricks cluster through the Azure Databricks UI and through features such as auto-scaling and auto-termination.

Diagram of Azure Databricks architecture.


Use Spark in notebooks


You can run many different kinds of application on Spark, including code in Python or Scala scripts, Java code compiled as a Java Archive (JAR), and others. Spark is commonly used in two kinds of workload:

  • Batch or stream processing jobs to ingest, clean, and transform data - often running as part of an automated pipeline.
  • Interactive analytics sessions to explore, analyze, and visualize data.
Code cells in notebooks have some features that can help you be more productive, including:

Syntax highlighting and error support.
Code auto-completion.
Interactive data visualizations.
The ability to export results.

The default language in a new Azure Databricks Spark notebook is PySpark - a Spark-optimized version of Python, Additionally, you can use languages such as Scala (a Java-derived language that can be used interactively) and SQL (a variant of the commonly used SQL language included in the Spark SQL library to work with relational data structures). 

Exploring data with dataframes


 load the data into a dataframe and display the first 10 rows:

Python
pyspark
df = spark.read.load('/data/products.csv',
    format='csv',
    header=True
)
display(df.limit(10))

Specifying a dataframe schema


from pyspark.sql.types import * from pyspark.sql.functions import * productSchema = StructType([ StructField("ProductID", IntegerType()), StructField("ProductName", StringType()), StructField("Category", StringType()), StructField("ListPrice", FloatType()) ]) df = spark.read.load('/data/product-data.csv', format='csv', schema=productSchema, header=False) display(df.limit(10)

Filtering and Grouping DataFrame

pricelist_df = df.select("ProductID", "ListPrice")


bikes_df = df.select("ProductName", "ListPrice").where((df["Category"]=="Mountain Bikes") | (df["Category"]=="Road Bikes")) display(bikes_df)

Group and aggregate data

counts_df = df.select("ProductID", "Category").groupBy("Category").count() display(counts_df)

Using SQL expressions in Spark

The Dataframe API is part of a Spark library named Spark SQL, which enables data analysts to use SQL expressions to query and manipulate data.

Creating database objects in the Spark catalog

df.createOrReplaceTempView("products")

view is temporary, meaning that it's automatically deleted at the end of the current session. You can also create tables that are persisted in the catalog to define a database that can be queried using Spark SQL.

Using the Spark SQL API to query data


bikes_df = spark.sql("SELECT ProductID, ProductName, ListPrice \
                      FROM products \
                      WHERE Category IN ('Mountain Bikes', 'Road Bikes')")
display(bikes_df)

Using SQL Code

%sql

SELECT Category, COUNT(ProductID) AS ProductCount
FROM products
GROUP BY Category
ORDER BY Category

Visualize data


One of the most intuitive ways to analyze the results of data queries is to visualize them as charts. Notebooks in Azure Databricks provide charting capabilities in the user interface, and when that functionality doesn't provide what you need, you can use one of the many Python graphics libraries to create and display data visualizations in the notebook.

Using graphics packages in code


from matplotlib import pyplot as plt

# Get the data as a Pandas dataframe
data = spark.sql("SELECT Category, COUNT(ProductID) AS ProductCount \
                  FROM products \
                  GROUP BY Category \
                  ORDER BY Category").toPandas()

# Clear the plot area
plt.clf()

# Create a Figure
fig = plt.figure(figsize=(12,8))

# Create a bar plot of product counts by category
plt.bar(x=data['Category'], height=data['ProductCount'], color='orange')

# Customize the chart
plt.title('Product Counts by Category')
plt.xlabel('Category')
plt.ylabel('Products')
plt.grid(color='#95a5a6', linestyle='--', linewidth=2, axis='y', alpha=0.7)
plt.xticks(rotation=70)

# Show the plot area
plt.show()


Get Started with Delta Lake


Delta Lake is an open-source storage layer that adds relational database semantics to Spark-based data lake processing. Delta Lake is supported in Azure Synapse Analytics Spark pools for PySpark, Scala, and .NET code.

The benefits of using Delta Lake in Azure Databricks include:

Relational tables that support querying and data modification. you can selectinsertupdate, and delete rows of data in the same way you would in a relational database system.

Support for ACID transactions
Data versioning and time travel. Because all transactions are logged in the transaction log, you can track multiple versions of each table row, and even use the time travel feature to retrieve a previous version of a row in a query

Support for batch and streaming data. While most relational databases include tables that store static data, Spark includes native support for streaming data through the Spark Structured Streaming API. Delta Lake tables can be used as both sinks (destinations) and sources for streaming data.
Standard formats and interoperability. The underlying data for Delta Lake tables is stored in Parquet format, which is commonly used in data lake ingestion pipelines.

Creating a Delta Lake table from a dataframe


For example, the following PySpark code loads a dataframe with data from an existing file, and then saves that dataframe to a new folder location in delta format:

# Load a file into a dataframe
df = spark.read.load('/data/mydata.csv', format='csv', header=True)

# Save the dataframe as a delta table
delta_table_path = "/delta/mydata"
df.write.format("delta").save(delta_table_path)

After saving the delta table, the path location you specified includes parquet files for the data (regardless of the format of the source file you loaded into the dataframe) and a _delta_log folder containing the transaction log for the table.

You can replace an existing Delta Lake table with the contents of a dataframe by using the overwrite or append mode, 

new_df.write.format("delta").mode("overwrite").save(delta_table_path)

new_rows_df.write.format("delta").mode("append").save(delta_table_path)

Making conditional updates

 DeltaTable object in the Delta Lake API, which supports updatedelete, and merge operations. 

from delta.tables import *
from pyspark.sql.functions import *

# Create a deltaTable object
deltaTable = DeltaTable.forPath(spark, delta_table_path)

# Update the table (reduce price of accessories by 10%)
deltaTable.update(
    condition = "Category == 'Accessories'",
    set = { "Price": "Price * 0.9" })

Querying a previous version of a table

Delta Lake tables support versioning through the transaction log. 
You can retrieve data from a specific version of a Delta Lake table by reading the data from the delta table location into a dataframe, specifying the version required as a versionAsOf option:

df = spark.read.format("delta").option("versionAsOf", 0).load(delta_table_path)

Alternatively, you can specify a timestamp by using the timestampAsOf option:

df = spark.read.format("delta").option("timestampAsOf", '2022-01-01').load(delta_table_path)

Create and query catalog tables

Completed100 XP

So far we've considered Delta Lake table instances created from dataframes and modified through the Delta Lake API. You can also define Delta Lake tables as catalog tables in the Hive metastore for your Spark cluster, and work with them using SQL.


Tables in a Spark catalog, including Delta Lake tables, can be managed or external;

  • managed table is defined without a specified location, and the data files are stored within the storage used by the metastore. Dropping the table not only removes its metadata from the catalog, but also deletes the folder in which its data files are stored.
  • An external table is defined for a custom file location, where the data for the table is stored. The metadata for the table is defined in the Spark catalog. Dropping the table deletes the metadata from the catalog, but doesn't affect the data files.

Creating a catalog's table using from data frame:

# Save a dataframe as a managed table
df.write.format("delta").saveAsTable("MyManagedTable")

## specify a path option to save as an external table
df.write.format("delta").option("path", "/mydata").saveAsTable("MyExternalTable")

Creating a catalog table using SQL

spark.sql("CREATE TABLE MyExternalTable USING DELTA LOCATION '/mydata'")

or

%sql

CREATE TABLE MyExternalTable
USING DELTA
LOCATION '/mydata'

if we need to replace table on every execution then use: CREATE TABLE IF NOT EXISTS statement or the CREATE OR REPLACE TABLE

Create empty table with schema:

%sql

CREATE TABLE ManagedSalesOrders
(
    Orderid INT NOT NULL,
    OrderDate TIMESTAMP NOT NULL,
    CustomerName STRING,
    SalesTotal FLOAT NOT NULL
)
USING DELTA

Create table using delta table builder pi:

from delta.tables import *

DeltaTable.create(spark) \
  .tableName("default.ManagedProducts") \
  .addColumn("Productid", "INT") \
  .addColumn("ProductName", "STRING") \
  .addColumn("Category", "STRING") \
  .addColumn("Price", "FLOAT") \
  .execute()

Fetch data from table:

%sql

SELECT orderid, salestotal
FROM ManagedSalesOrders

Use delta lake for streaming the data:

Spark includes native support for streaming data through Spark Structured Streaming, an API that is based on a boundless dataframe in which streaming data is captured for processing. A Spark Structured Streaming dataframe can read data from many different kinds of streaming source, including network ports, real time message brokering services such as Azure Event Hubs or Kafka, or file system locations.

Streaming with delta lake:

You can use a Delta Lake table as a source or a sink for Spark Structured Streaming. For example, you could capture a stream of real time data from an IoT device and write the stream directly to a Delta Lake table as a sink - enabling you to query the table to see the latest streamed data. Or, you could read a Delta Table as a streaming source, enabling you to constantly report new data as it is added to the table.

Using a Delta Lake table as a streaming source

 A stream is created that reads data from the Delta Lake table folder as new data is appended

from pyspark.sql.types import *
from pyspark.sql.functions import *

# Load a streaming dataframe from the Delta Table
stream_df = spark.readStream.format("delta") \
    .option("ignoreChanges", "true") \
    .load("/delta/internetorders")

# Now you can process the streaming data in the dataframe
# for example, show it:
stream_df.show()
After reading the data from the Delta Lake table into a streaming dataframe, you can use the Spark Structured Streaming API to process it.

Using a Delta Lake table as a streaming sink

from pyspark.sql.types import *
from pyspark.sql.functions import *

# Create a stream that reads JSON data from a folder
streamFolder = '/streamingdata/'
jsonSchema = StructType([
    StructField("device", StringType(), False),
    StructField("status", StringType(), False)
])
stream_df = spark.readStream.schema(jsonSchema).option("maxFilesPerTrigger", 1).json(inputPath)

# Write the stream to a delta table
table_path = '/delta/devicetable'
checkpoint_path = '/delta/checkpoint'
delta_stream = stream_df.writeStream.format("delta").option("checkpointLocation", checkpoint_path).start(table_path)

After the streaming process has started, you can query the Delta Lake table to which the streaming output is being written to see the latest data.

%sql

CREATE TABLE DeviceTable
USING DELTA
LOCATION '/delta/devicetable';

SELECT device, status
FROM DeviceTable;

To stop the stream of data being written to the Delta Lake table, you can use the stop method of the streaming query:

delta_stream.stop()

SQL Ware house with data bricks:

SQL Warehouses (formerly known as SQL Endpoints) provide a relational database interface for data in Azure Databricks. The data is stored in files that are abstracted by Delta tables in a hive metastore, but from the perspective of the user or client application, the SQL Warehouse behaves like a relational database.

When you create a premium-tier Azure Databricks workspace, it includes a default SQL Warehouse named Starter Warehouse, which you can use to explore sample data and get started with SQL-based data analytics in Azure Databricks.

create schema

CREATE SCHEMA salesdata;

You can use the user interface in the Azure Databricks portal to upload delimited data, or import data from a wide range of common data sources. The imported data is stored in files in Databricks File System (DBFS) storage, and a Delta table is defined for it in the Hive metastore.

CREATE TABLE salesdata.salesorders
(
    orderid INT,
    orderdate DATE,
    customerid INT,
    ordertotal DECIMAL
)
USING DELTA
LOCATION '/data/sales/';

Dashboards

Dashboards enable you to display the results of queries, either as tables of data or as graphical visualizations.

you can schedule the dashboard to refresh is data periodically, and notify subscribers by email that new data is available.